6.1. User Defined Functions
Let’s learn how to define our own functions in gnuplot.
As you know, we can plot all kinds of mathematical functions (see Builtin Functions) with gnuplot. However, an important class of functions are ones that we can make up ourselves out of other functions. If it’s not already running, start gnuplot.
We already learned how to use gnuplot as a calculator to define our own variables, as you did in Homework 5, where you calculated the power output of the sun. There, you defined constants made of numbers and builtin constants, such as
gnuplot> T = 5.5e3             # set temp. of sun's surface
gnuplot> r = 7e8               # solar radius
gnuplot> A = 4 * pi * r**2     # surface area
gnuplot> print A
6.15752160103599e+018          # in m**2
gnuplot> P = flux * T**4 * A   # solar power output
gnuplot> print P
3.27/19391028086952e+026          # in watts
You can also define functions.
Try this:
gnuplot> f(x) = 3*x**2 - 2*x + 4
gnuplot> plot f(x)
You should have gotten a parabola. You can also define a function of several variables:
gnuplot> f(x,a,b) = a*x - b
gnuplot> plot f(x,1,2), f(x,3,-2)
You can use functions in other functions
gnuplot> set hidden
gnuplot> set isosamples 30
gnuplot> r(x,y) = sqrt(x*x + y*y)
gnuplot> splot [-2:2][-2:2] exp(-r(x,y))*cos(pi*r(x,y))
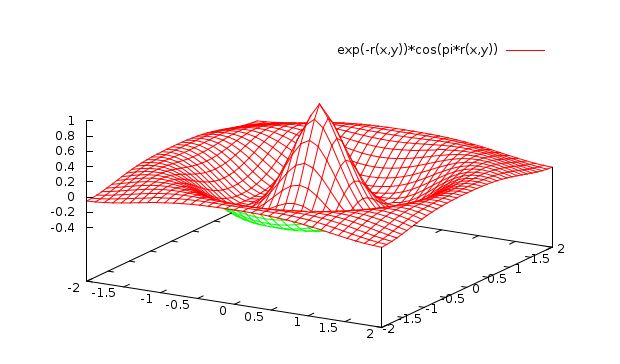
You can build quite complicated functions with gnuplot. Remember however, that the variable that is used for plotting in a 2-D plot is always x.
Note
Actually what I said above about x is not 100% true; you can do:
set polar
which will make the default plot variable t (for “theta ”).
This makes gnuplot plot functions as distance from the origin (radius) vs. angle t . The default range is 2*pi radians).
6.1.1. The Conditional Function
One very useful construct that I sometimes use is the C programming if/then shorthand notation which gnuplot recognizes:
‘( conditional phrase ) ? ( if TRUE value ) : ( if FALSE value )’
The conditional phrase is a question such as
x == 0            # is x equal to zero?
x != 0            # is x NOT equal to zero?
X > 4 || x < 3    # is x greater than 4  OR less than 3?
x >= 0 && x <= y  # is x greater to or equal to zero  AND less than or equal to y?
where we have used the programming logical conditions:
- ==
- !=
- >
- <
- >=
- <=
- &&
- ||
The last two, ‘&&’ and ‘||’, if you haven’t figured them out already, are &&–meaning logical AND (both things must be true, for the whole phrase to be true), and ||–meaning logical OR (only one part needs to be true for the phrase to evaluate as true).
If the question part is TRUE, the result is the thing between the ? and : If the question is FALSE, the result is the thing after the :
Here’s an example. Plot a function whose value is f(x) = 5 if x is between 0 and 1, but f(x) = 0 otherwise.
gnuplot> f(x) = (x>0 && x<1) ? 5 : 0
gnuplot> set xzeroaxis
gnuplot> plot [-1:2][-1:6] f(x)
Try it! Such constructs could be handy in Digital Signal Processing classes.
You can even define functions recursively , such as the factorial function, n! = n*(n-1)*(n-2)...3*2*1.
gnuplot> fac(n) = (n != 0) ? n*fac(n-1) : 1
gnuplot> print fac(3)
6
gnuplot> print fac(5)
120
gnuplot> print fac(8)
40320
gnuplot> print fac(10)
3628800
6.1.2. Functions with Constants
One last thing. Notice that I can define a function with a variable, c, in it:
gnuplot> f(x) = c/sqrt(1 + x)
However when I try to plot the function, gnuplot complains that the variable c is not defined, hence it, rightly, doesn’t know how to plot the function.
gnuplot> plot f(x)
        undefined variable: c
If I go ahead and define c
gnuplot> c = 5
gnuplot> plot f(x)
gnuplot can now plot the function, since it knows how to evaluate it.
I can update the value of c by typing
‘c = 10’ , and ‘replot’,
and I’ll get a new function ‘f(x) = 10/sqrt(1 + x)’.
Notice too that gnuplot stopped plotting for x <= 1 , since the function becomes complex for x < 1. In fact it’s singular at x = -1. It will however, still tell you the complex value if you ask:
gnuplot> print f(-2)
{0.0, -5.0}
Next, we’ll use the ability to define functions with constants to let gnuplot find the “Best” constants for the function to “fit” our data.