5.3. 3-D Plots with Gnuplot
You can plot many interesting mathematical functions f(x) with gnuplot such as you have been doing in the previous exercises.
Another powerful feature of gnuplot is the ability to plot functions of two variables as a surface z = f(x,y). There are some examples of what gnuplot can do at the top of this page.
To see what I mean, start gnuplot and type the following at the prompt:
gnuplot> splot x**2 + y**2
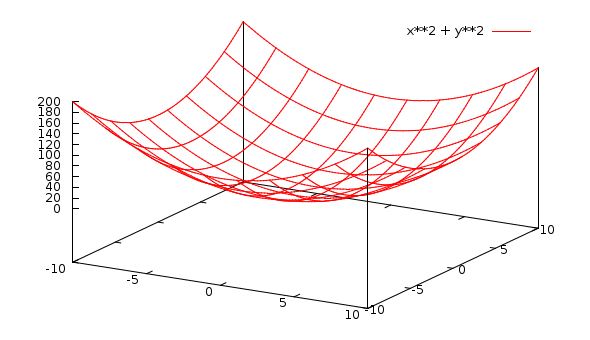
This will produce a simple rectangular parabolic “bowl” shaped surface
(hence the command s plot ), which represents the function
 .
.
Here we used splot (surface plot) instead of the previous plot command which is reserved for 2-d f(x) plots.
You should be able to “grab” the splot with your mouse , click and hold down the right mouse button, and move the mouse.
This will rotate the graph so that you can see it from different angles, allowing you to explore the 3-dimensionality of the surface.
Try another plot:
gnuplot> splot [0:pi][0:pi] sin(x*y)
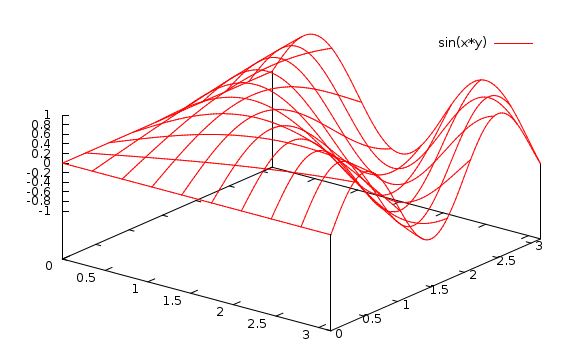
You can see the interesting shape (can you grab it and look at it from different angles?).
Notice the plot ranges [0:pi] for both x and y . (Remember that gnuplot recognizes the word “pi”)
If you wanted to fix the plot ranges, so that you didn’t have to keep typing them, you could type:
gnuplot> set xrange [0:pi]
gnuplot> set yrange [0:pi]
then do:
gnuplot> splot sin(x*y)
This will set the default ranges to [0:pi] (of course you could set any ranges you want. Sometimes this is a time saver.
Let’s try to make the plot better.
First, let’s make the surface non-transparent. Type this:
gnuplot> set hidden
gnuplot> replot
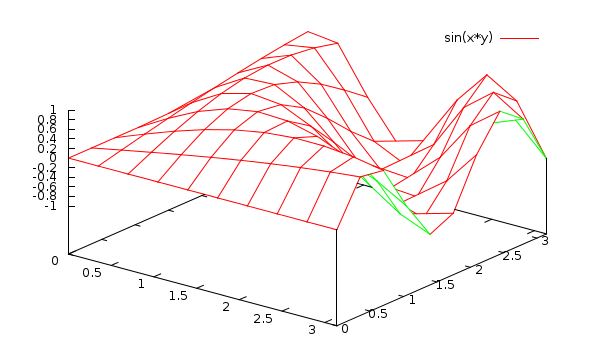
Now the surface is opaque, and the underside is a different color. Notice too that replot recalls the last plot.
Still the surface is a litle clunky–it’s made of large plane “panels”.
If these were smaller, the surface would be more smooth. Type:
gnuplot> set isosamples 20
gnuplot> replot
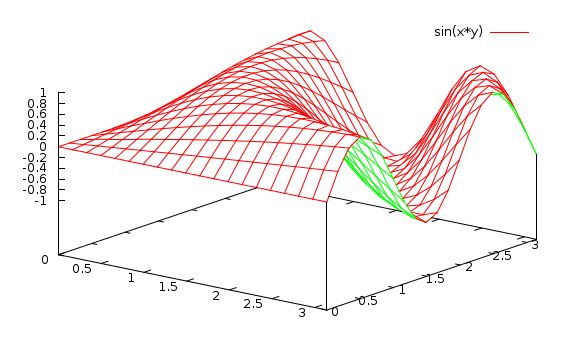
Much better. You could also have done set isosamples 35 or any other number.
The isosamples are the number of “samples” in each direction (x and y).
Note that if you are doing a 2-D plot , you would set samples to increase the sampling resolution, not isosamples–which are only for 3-D splots.
That is:
- 2-D: plot: set samples n (default is 100)
- 3-D: splot: set isosamples n (default is 10 in each direction)
If you ever want to see what value a variable is currently set to, do
gnuplot> show isosamples
        iso sampling rate is 20, 20
(notice that you could set the isosample in x and y separately. If you give only one number, both x and y are set to the same value.)
It is generally true for any variable, that you can see what it’s value is by typing show var
where var is something with a value like isosamples or xtics, etc..
You can see all the variables (and classes of variables) that you are able to set by typing just show by itself.
gnuplot> show
             ^
         valid set options:  [] = choose one, {} means optional

        'all', 'angles', 'arrow', 'autoscale', 'bars', 'border', 'boxwidth', 'clip',
        'cntrparam', 'colorbox', 'contour', 'datafile', 'decimalsign','dgrid3d',
        'dummy', 'encoding', 'fit', 'fontpath', 'format', 'functions', 'grid',
        'hidden', 'isosamples', 'key', 'label', 'loadpath', 'locale', 'logscale',
        'mapping', 'margin', 'offsets', 'origin', 'output', 'plot',
        'palette', 'parametric', 'pm3d', 'pointsize', 'polar', 'print', '[rtuv]range',
        'samples', 'size', 'style', 'terminal', 'tics', 'timestamp',
        'timefmt', 'title', 'variables', 'version', 'view',
        '[xyz,cb]{2}label', '[xyz,cb]{2}range', '{m}[xyz,cb]{2}tics',
        '[xyz,cb]{2}[md]tics', '{[xyz]{2}}zeroaxis', '[xyz,cb]data', 'zero'
This confuses gnuplot into asking you which variable you want to show, and it shows you all the options.
You can also do: help set, followed by one of the options listed.
If you want, you can type show all which dumps everything.
We won’t be doing anything with splot for a while, but I wanted to introduce you to it since it produces some cool plots.
For a bit more eye candy, have a look at some of the plots on the Surfaces and 3-D Plots on the Demo page on the Gunplot site: Gnuplot Demos
You can make any of these plots with Gnuplot on your computer now! (you may need the data file from the Gnuplot site to reproduce some of them).
A really nice feature of the demo page is that the commands to produce the plots is also listed. Unfortunately, some of the plots require data files, and those are not so easy to get (I have them though, if you are really interested in reproducing one of the plots). Some of the plots use advanced features that we won’t cover in this course, however you can always learn about these from the online documentation.
One more fun thing to do. Start gnuplot, type:
gnuplot> set isosamples 30
gnuplot> set hidden3d
gnuplot> set  **contour**
gnuplot> splot exp(-(x**2+y**2)/50)*sin(x/3)*y**2
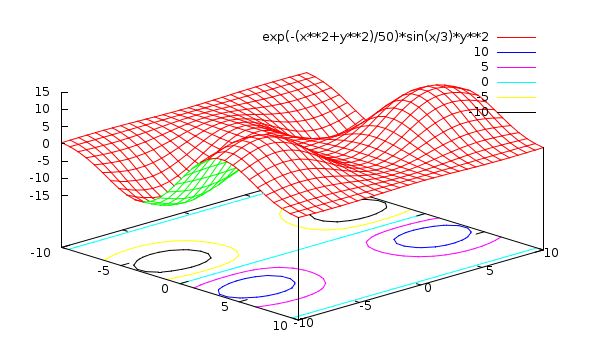
Do you see what happened? You produced ” contour ” lines on the “floor” of the plot. This can be useful when your surface is complicated and you want to understand its structure. The contour plot is like a “topo” map that you may have used when hiking.
If you are alert, you will notice that even though the surface is quite bumpy, there is a particular straight path which is at constant “height”. This would be very useful to know if you were a Civil Engineer building a road through this terrain.
If you just want the contour map, you can do this:
gnuplot> set size square
gnuplot> unset surface
Then grab the plot and look at it “from the top” (as if you are looking down the z axis.
You can get your surface back by doing
gnuplot> set surface
Next we must learn to plot our own data from a file , which we might have taken from an experiment for example.
Before moving on to plotting data files however, try experimenting with surface plotting of some functions of your own.
Make up some functions, f(x,y), and plot them.